Requirements.
> Ubuntu Machine 1 (For Server)
> Ubuntu Machine 2 (For Agent)
In this post, I assume you already have installed Docker, so I only show how to set up Prometheus and Grafana.
1. Create a directory name `Monitoring`, and change directory into that.
mkdir Monitoring; cd Monitoring
2. Create a directory name Prometheus. Inside it, create a configuration file name `prometheus.yml`.
mkdir Prometheus; cd Prometheus; touch prometheus.yml3. Now modify `prometheus.yml` file, and add the following. Change `localhost` in `prometheus.yml` to your IP.
# my global config
global:
  scrape_interval:     15s # Set the scrape interval to every 15 seconds. Default is every 1 minute.
  evaluation_interval: 15s # Evaluate rules every 15 seconds. The default is every 1 minute.
scrape_configs:
  - job_name: 'prometheus'
    static_configs:
    - targets: ['128.199.191.154:9090']
  - job_name: 'node_explorer'
    static_configs:
    - targets: ['128.199.191.154:9100', '128.199.191.153:9100']
4. Run the following command to run the Prometheus container. Change /home/hakase/Monitoring/Prometheus/prometheus.yml to your own path.
docker run \
    -d \
    -p 9090:9090 \
    -v /home/hakase/Monitoring/Prometheus/prometheus.yml:/etc/prometheus/prometheus.yml \
    prom/prometheus
5. Now open your browser, to your IP with port 9090. Go to Status > Targets.


7. Now go to your Ubuntu Machine 2. Run the following command.
wget -c https://github.com/prometheus/node_exporter/releases/download/v0.18.1/node_exporter-0.18.1.linux-amd64.tar.gz
8. Extract the files, and change directory into it.
tar -xzvf node_exporter-0.18.1.linux-amd64.tar.gz; cd node_exporter-0.18.1.linux-amd64
9. Now run the node_exporter
./node_exporter
10. At this point, you are ready to visualize the data into Grafana. Back to your Ubuntu Machine 1. Run the following command.
docker run -d -p 3000:3000 grafana/grafana
11. Now open your browser and go to your IP with port 3000. Login with default username and password, which is admin
12. You can change your password here or skip this process.

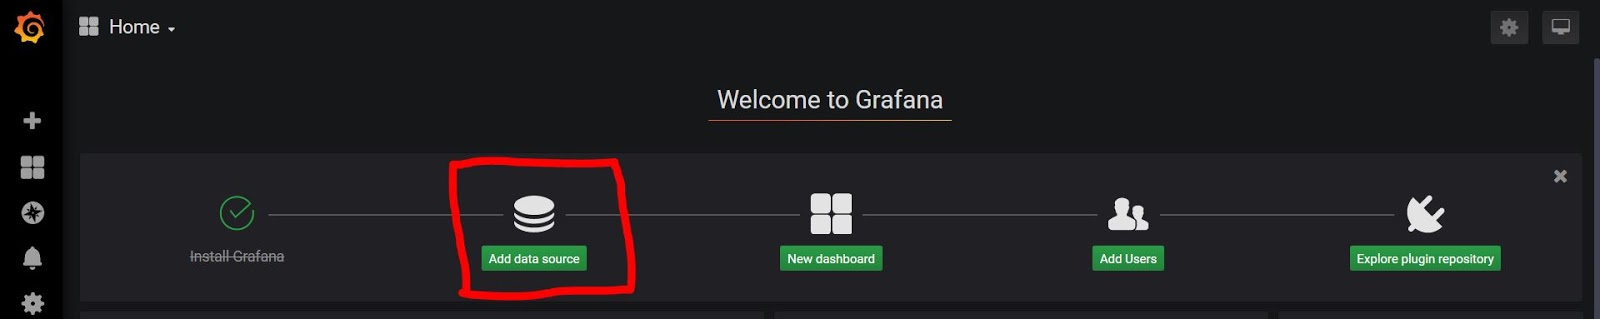
13. Now Add Data Source.
14. Select Prometheus.

15. Enter your Prometheus IP and Port. After that, scroll down and click Save & Test.

16. On your left side, click Click > Import.

17. Enter 1860, and click Load.

18. Select your Prometheus, and then click Import.

19. Now you should be redirected to graph page.

source:
https://www.youtube.com/watch?v=4WWW2ZLEg74
https://prometheus.io/docs/prometheus/latest/installation/#using-docker
https://github.com/prometheus/prometheus/blob/master/documentation/examples/prometheus.yml
https://grafana.com/docs/grafana/latest/installation/docker/
Comments
Post a Comment